In class we played three different games with a partner and recorded our scores randomly as a class. (For example, we recorded the 4th best score, 5th best, and best out of 5) We then created the following tables and graphs to present our data.
1. Bashing Pumpkins - Histogram and Frequency Distribution Table


2. Simon Says - Frequency Polygon and Relative Frequency


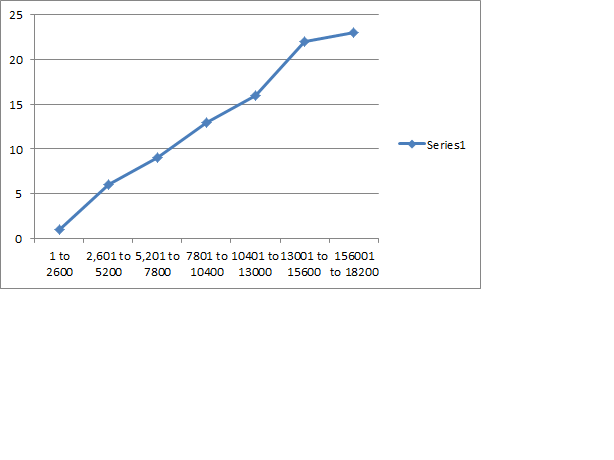
3. Snap Shots- Ogive and Cumulative Frequency

4. Class' favorite game - Bar graph


Nice. Now choose one of your three graphs and draw some conclusions about the graph and the data. If you can tell me what kind of statistics your conclusions are, you'll get a bonus point.
ReplyDeleteMr. Mays!