Thursday, September 27, 2012

The Empirical Rule

The Empirical Rule (aka 68-95-99.7 rule) is a way to measure how your data can vary by a few numbers. A bell shape represents all the data with the majority being in the middle. A Z score of "0" runs down the midde of the graph and from each side branches out to Z scores of 1 and 2 (right) and -1 and -2 (left side). From Z scores -1 to 1, represents about 68% of the data. From -2 to 2, it represents about 95% of the data, and from Z scores -3 to 3 represent about 99.7% of your data.

ex) It takes the majority of adults that work downtown 45 minutes to get to work in the morning with a standard deviation of 2.
a) How often do they arive in less than 47 minutes to work?
b) How often does it take more than 49 minutes to get to work?


a: 100% - 16% = 84%
They will arrive to work in less than 47 minutes about 84% of the time

b: 100% - 95% = 5% divided by 2 (tails) = 2.5%
It will take more than 49 minutes to get to work about 2.5% of the time

Monday, September 24, 2012

Super Hero Project


Cheetah girl was born in Brooklyn New York in 1970. After reaching the age of 23 she was bitten by a cheetah which gave her super powers and stopped her from aging from then on. Its powers are invisible, extremely fast, and she can fly. She first discovered her powers when she was walking down the street to go to the grocery store when she heard a cry for help. This old woman’s purse was stolen by a thief and immediately cheetah girl said she would track them down. At this moment cheetah girl realized she was born to be a super hero. Without cheetah girl that sweet old lady would’ve never got her purse back.

Monday, September 17, 2012

Lil Games

Partner- Jen Williams

In class we played three different games with a partner and recorded our scores randomly as a class. (For example, we recorded the 4th best score, 5th best, and best out of 5) We then created the following tables and graphs to present our data.

1. Bashing Pumpkins - Histogram and Frequency Distribution Table

2. Simon Says - Frequency Polygon and Relative Frequency
3. Snap Shots- Ogive and Cumulative Frequency

4. Class' favorite game - Bar graph


Thursday, September 6, 2012

Gummy Bear Experiment


3. The goal of this experiment was too see if the launcher of the gummy bear affects the distance we could launch it.

4. The factors for this experiment were the position of the gummy bear and who was the launcher. The levels of our experiment was the position being either “butt or back” and the launcher of the catapult “Gage or matt”. Our treatments were “butt matt, back matt, gage butt, or gage back” this was all depending on random names and positions drawn randomly.

5. For us to use randomization in our experiment, we had four pieces of paper with our names on it and the position of the bear in the catapult. We had our recorder randomly pick a name and the name that was drawn each time launched the gummy bear depending on the position that was chosen.

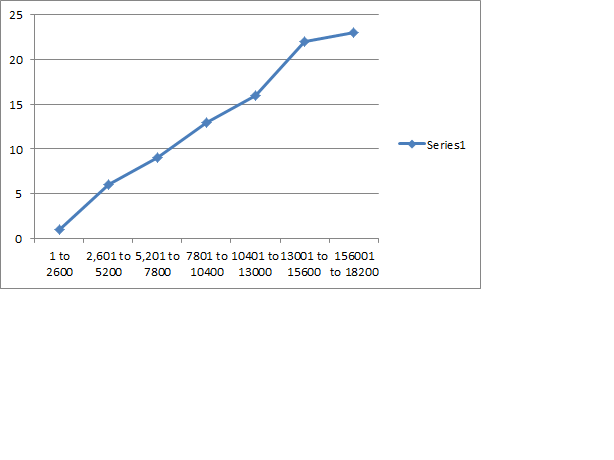
6. For our data collection we used a measurement of “tiles” and counted how many tiles the gummy bear had passed before it landed from a starting point. To collect our data we had a data table with table headings with each treatment and also the accuracy of the launcher.

7.

·         The means were Matt butt was 11.35, Matt back was 10.90, Gage butt 19.55, Gage back 18.65

·         The medians were matt butt 14.00, Matt back 11.00, Gage Butt 21.50, Gage Back 20.0.

·         The ranges are Matt butt 19, Matt back 21, Gage butt, 21, Gage back 22.

·         The mode for each is Matt butt 16, Matt back 13, Gage butt 22, Gage back no mode.
8. Based on the descriptive statistics we collected above, we can conclude which launcher and which position launches the gummy bear the furthest. The mean for the treatments involving Gage were 19.55 and 18.65, higher than Matt’s 11.35 and 10.90. This is a reoccurring trend in our descriptive statistics, like in range for example. In conclusion, Gage could launch the gummy bear further whereas Matt wasn’t as far, yet more accurate. The gummy bear being on its behind also seemed to improve distance launched.